Observability is the ability to understand a system from the signals it emits. On AWS, several services contribute, but they are not interchangeable.
CloudWatch covers operational telemetry
CloudWatch collects service metrics, custom metrics, logs, alarms, and dashboards. Use it to answer questions such as: Is the error rate rising? Are requests slow? Is the queue backlog growing? Did database connections hit a limit?
Default metrics are useful but rarely describe the whole customer experience. Publish application and business metrics for outcomes that matter. A queue consumer can report healthy CPU while orders wait for an hour.
X-Ray and traces explain request paths
Distributed tracing follows a request through services and dependencies. It records segments, subsegments, timing, errors, and annotations that help locate where latency or failure accumulated.
Sampling controls cost and volume. Correlation IDs make it possible to connect a trace to application logs and customer-facing errors. OpenTelemetry can provide a vendor-neutral instrumentation path while sending telemetry into AWS services or another backend.
CloudTrail records AWS API activity
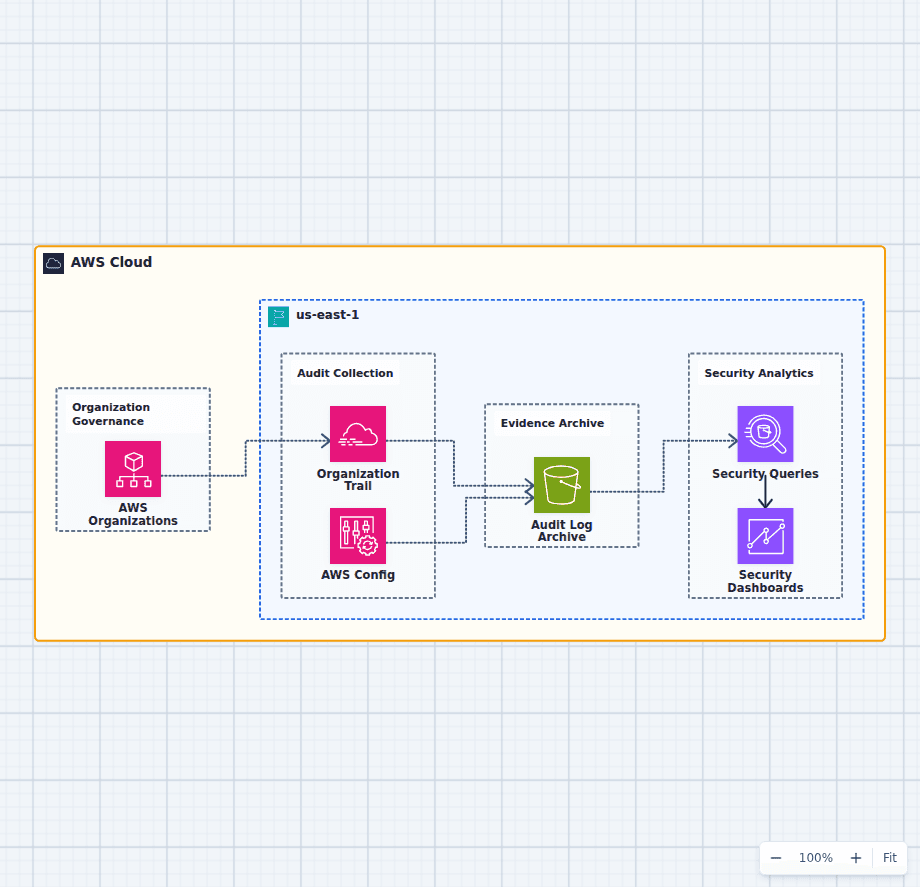
CloudTrail answers control-plane and selected data-event questions: who changed a security group, deleted a resource, updated a role, or called an API? It is an audit trail, not a replacement for application logging.
Create an organization trail where appropriate, send evidence to protected central storage, and decide which high-volume data events are worth enabling.
Design signals around service levels
Start with customer-facing indicators such as availability, latency, correctness, and freshness. Define objectives and an error budget. Then attach alarms to symptoms that require action.
A good alert includes the affected service, signal, severity, likely customer impact, dashboard, and runbook. Avoid paging on every internal fluctuation. A noisy alarm teaches people to ignore it.
Use the golden signals carefully
Request rate, errors, duration, and saturation are a useful baseline. Add queue age, retry count, dead-letter volume, dependency errors, deployment markers, and data freshness where they apply.
For asynchronous flows, measure from business event creation to business completion. Individual Lambda invocations can all succeed while a missing route prevents any order from reaching fulfillment.
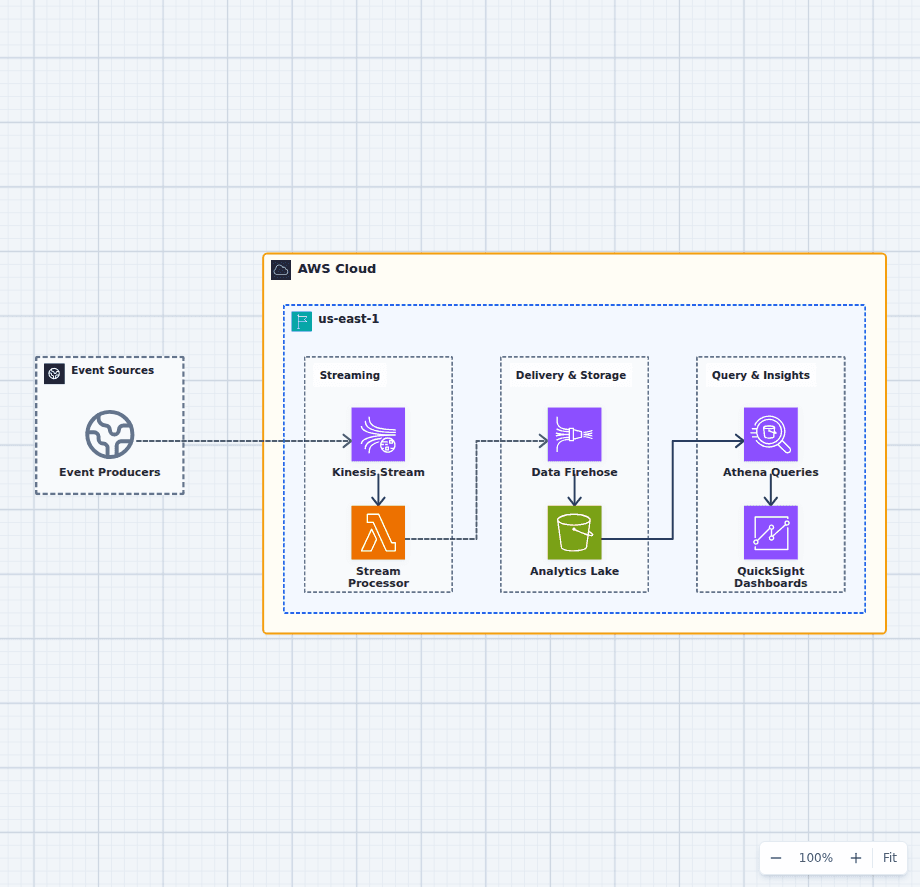
The real-time streaming analytics architecture and event-driven order processing architecture are good exercises for identifying end-to-end signals.
Control telemetry cost
High-cardinality custom metrics, verbose logs, long retention, and unbounded trace collection can become expensive. Use structured logs, deliberate retention, useful dimensions, sampling, and tiered storage. Do not drop the very evidence needed for incident response just to make a graph cheaper.
The practical outcome
Website X-Ray's Core Web Vitals optimization guide is a useful companion for connecting CloudWatch and trace evidence to field LCP, INP, and CLS outcomes on public websites.
When an incident starts, an operator should be able to move from customer symptom to affected path, then to the local failure and the change that caused it. That is the difference between collecting telemetry and building observability.