
AWS Data Lakehouse Analytics Architecture
Data lands in an S3 raw zone, is transformed by AWS Glue into curated datasets, and is queried with Athena for QuickSight dashboards.
Open editable diagramArchitecture diagram
Edit this exact diagram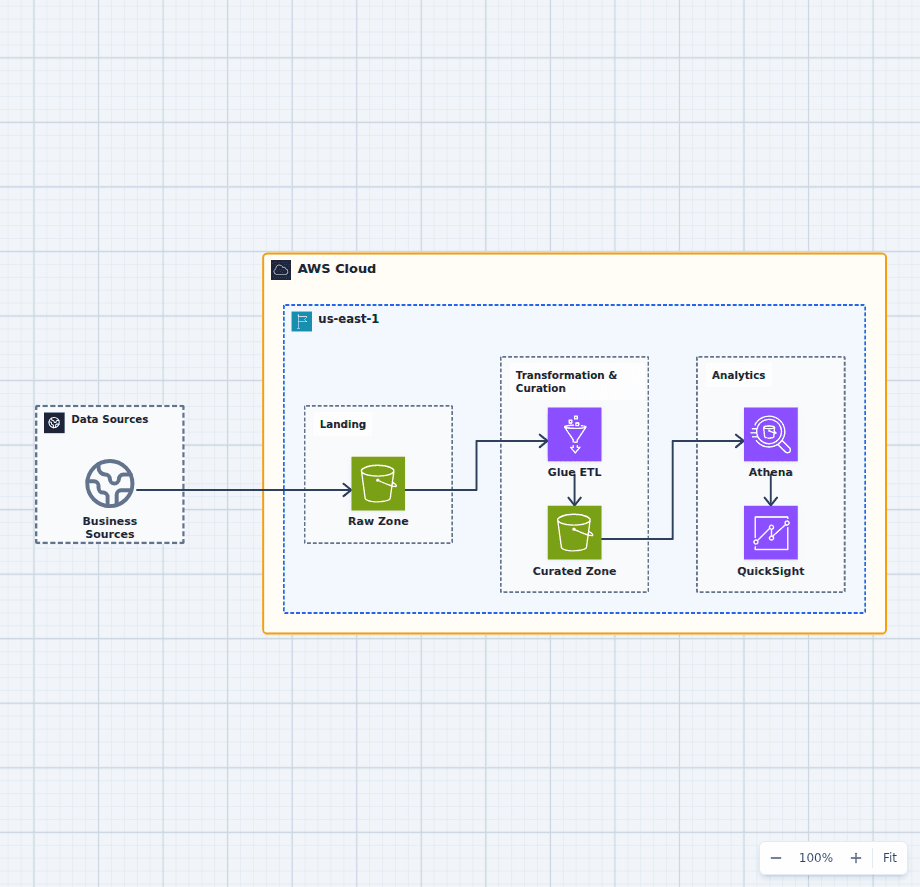 Open on the canvas
AWS lakehouse architecture diagram with raw and curated Amazon S3 zones, AWS Glue, Athena, and QuickSight. The image links to a fully editable BuildPlane starter.
Overview
Business data sources deliver immutable extracts into an S3 raw zone. AWS Glue validates and transforms those records into partitioned curated datasets in a separate S3 zone. Athena queries the curated data, and QuickSight presents governed analytical views.
Components
- Raw and curated S3 zones: Separate storage zones preserve source fidelity while exposing optimized analytical datasets.
- AWS Glue: Managed transformation jobs clean, join, and partition source data into the curated zone.
- Athena and QuickSight: Serverless SQL and dashboards make curated data accessible to analysts and decision makers.
Lakehouse Data Flow
- Business sources deliver immutable extracts into the raw S3 zone.
- Glue transforms and validates source records before writing curated datasets.
- Athena queries the curated zone and QuickSight presents governed analytical views.
Customize First
- Define ownership, schema evolution, and quality checks for every curated dataset.
- Add Lake Formation when centralized fine-grained data permissions are required.
- Set lifecycle and compaction policies from actual query patterns and retention obligations.
Related AWS guides
Understand the decisions behind this diagram
Use these practical explanations to compare services, failure boundaries, and operating tradeoffs before adapting the architecture.
Design rationale
Decisions that shape this architecture
Keep the raw zone immutable
Source-aligned objects provide a replay point when transformation code, schemas, or analytical requirements change.
Publish curated data as a product
Glue writes validated, documented, partitioned datasets rather than letting every dashboard interpret raw exports independently.
Start with serverless consumption
Athena and QuickSight avoid permanent query infrastructure while usage patterns and performance requirements are still being discovered.
Before production
Operational checks
Track source freshness, schema drift, row counts, data-quality failures, and lineage.
Compact small files and review partition design against the most common queries.
Apply encryption, least-privilege access, retention, and deletion controls per zone.
Monitor Glue failures, Athena bytes scanned, query latency, and dashboard refresh age.
Scope and tradeoffs
What this diagram does not solve
The platform needs a metadata and ownership model
Storage zones alone do not create trusted data. Teams still need schemas, lineage, owners, quality contracts, and governed access.
Athena may not fit every workload
High-concurrency, low-latency, or complex warehouse workloads may justify Redshift or another serving layer after measurement.
Common questions
Frequently asked questions
What is the difference between the raw and curated zones?
The raw zone preserves source-aligned data for replay, while the curated zone publishes cleaned, validated, and query-optimized datasets.
Why use Parquet in the curated zone?
Columnar formats such as Parquet reduce scan volume and improve analytical query efficiency compared with row-oriented text exports.
When should Lake Formation be added?
Add it when the platform needs centralized catalog permissions, fine-grained data access, cross-account sharing, and consistent governance workflows.
Keep exploring
Related AWS architectures
Governed Data Lake and Analytics Platform on AWS
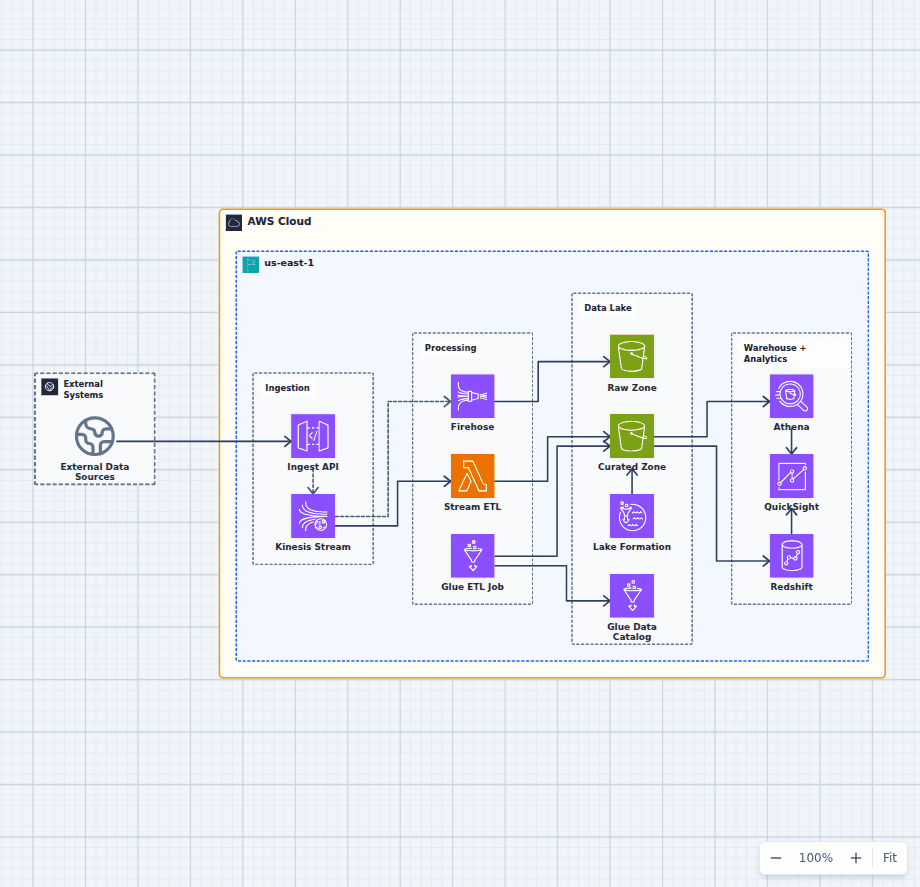
This architecture supports both near-real-time processing and batch-oriented curation. Kinesis fans data into a fast Lambda path and a Firehose landing path, Glue creates query-ready datasets, and Lake Formation applies governance across Athena, Redshift, and QuickSight.
Explore the architecture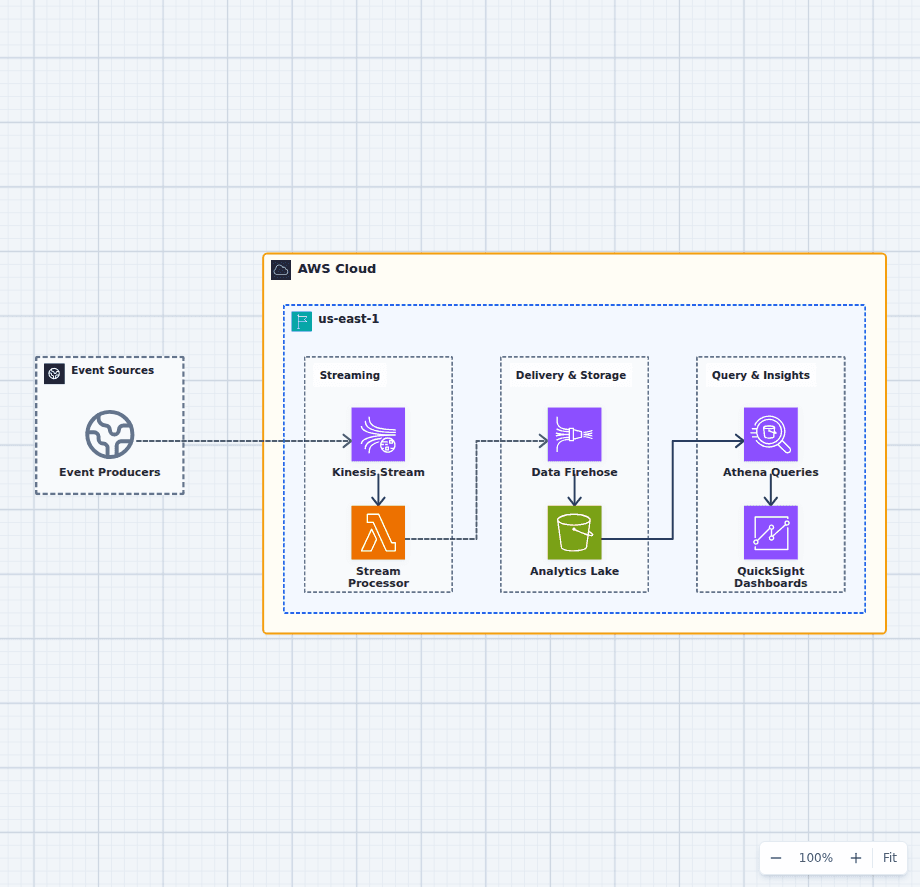
Real-Time Streaming Analytics on AWS
This streaming analytics architecture decouples burst absorption, event transformation, durable delivery, query, and visualization. Each responsibility scales independently, while S3 preserves the complete history needed for replay, deeper analysis, and later changes to dashboard logic.
Explore the architecture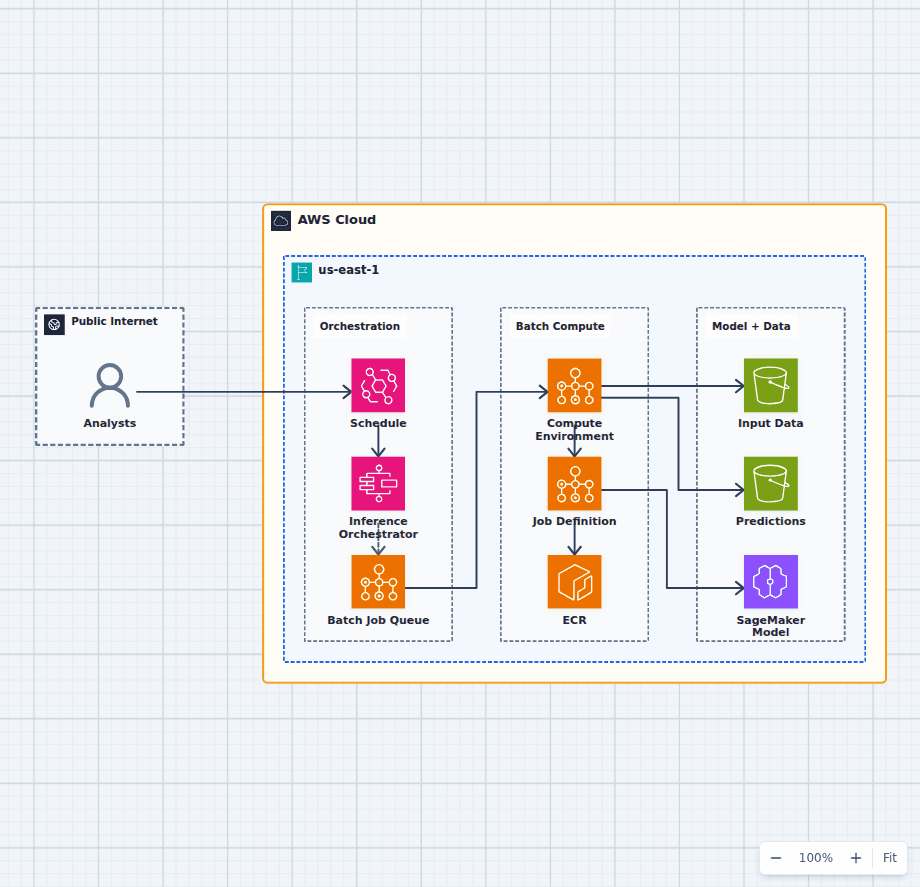
Machine Learning Batch Inference Platform on AWS
This architecture runs scheduled or on-demand scoring as a durable workflow. Step Functions coordinates jobs, AWS Batch supplies container compute, ECR pins the runtime, an approved SageMaker model supplies the artifact, and S3 preserves inputs and predictions.
Explore the architectureFrom reference to working draft
Adapt this architecture with your AWS AI Agent
Start from the exact diagram in this guide. Change requirements, challenge a decision, or ask what fails first, while keeping the architecture editable.